
Using US Census data to investigate the drop in youth vote share in 2020
Summary:
In this blog post we investigate how the youth vote share fell between the Democratic primaries in 2016 and 2020, while the number of youth voters actually grew. We use data from the US Census Bureau to show that the aging population distribution of the US is not enough to completely explain the above phenomenon, assuming voting rates were the same in 2020 as in 2016. Finally, we show the fraction of the population aged 18-29 will continue to decline in years to come.
Introduction:
After Super Tuesday, young voters were frequently scapegoated in the media for Bernie Sanders’s loses in Super Tuesday contests, like in the US Today article entitled “Many young voters sat out Super Tuesday, contributing to Bernie Sanders’ losses.” They reasoned that because a lot of polling conducted before Super Tuesday showed Sanders being strongly favored by younger voters and strongly disfavored by older voters, for Bernie to have lost, young people must not have made it to the polls. In this blog post, we investigate the accuracy of this claim.
At first glance, exit (and entrance) polling from CNN seems to support this notion. In the following table, I show the percentage of votes cast in Democratic primaries in states that voted on or before March 10th in both 2016 and 2020 by voters aged 18 to 29 years old. We see youth voters made up a smaller percentage of all voters in 2020 voters than in 2016 in 13 of the 15 states.
At the same time, when you consider the total number of voters aged 18 to 29 who cast votes in these 15 contests, you see that more of them voted this year than 4 years ago. For example, the youth vote share in Texas went down 5%, but the total number of youth voters increased by about 25,000. How can both changes be true? Of course, it means the number of older voters increased more between 2016 and 2020 than did the number of youth voters over the same time period. So while more young voters voted in many states in 2020 than did in 2016, the share of all votes casts by youth votes declined because the increase in older voters was even larger.
Could this be explained simply by the fact that the US population is aging, with the bulk of Baby Boomers entering retirement age? Or did older voters’ propensity to vote increase, too. I also wondered how projected demographic changes would affect electorate compositions in future elections.
The Data:
To satify these curiosities, I turned to the Census Bureau. They estimate the population siz of the US (and have done so since the Bureau was founded in 1902) and publish their estimates online. I was able to scrape together the US population broken down by single year of age since the year 1900. Given that the data was collected at various times over more than a century, the data isn’t perfectly homogenous in structure. For example, the only available data from 1900-1929 exclude members of the Armed Forces stationed overseas and the population residing in Alaska and Hawaii, the 1930-1959 numbers include Armed Forces overseas but exclude the population residing in Alaska and Hawaii, and the 2010s data has the most granular demographic breakdowns of the population of all decades (down to metropolitan division scales). I decided to use the data that include member of the Armed Forces stationed overseas in this analysis when available because, in principle, the Armed Forces could vote (although, in practice, I suspect it was difficult to impossible at the height of large wars). Methods for accessing the data vary, too; from excel spreadsheets on a webpage, like for 1900-1979, to an array of Census Population Estimates APIs for years 1990 to 2019.
Check it out! The python code I used to corral and clean the data can be found in a Python Jupyter Notebook on my GitHub page here.
With the US population per single year of age for every year from 1900 to 2020 (and projected out to 2060), I was able to calculate and plot the fraction of the population that falls in the category of youth voter (aged 18-29) since the beginning of the 20th Century.
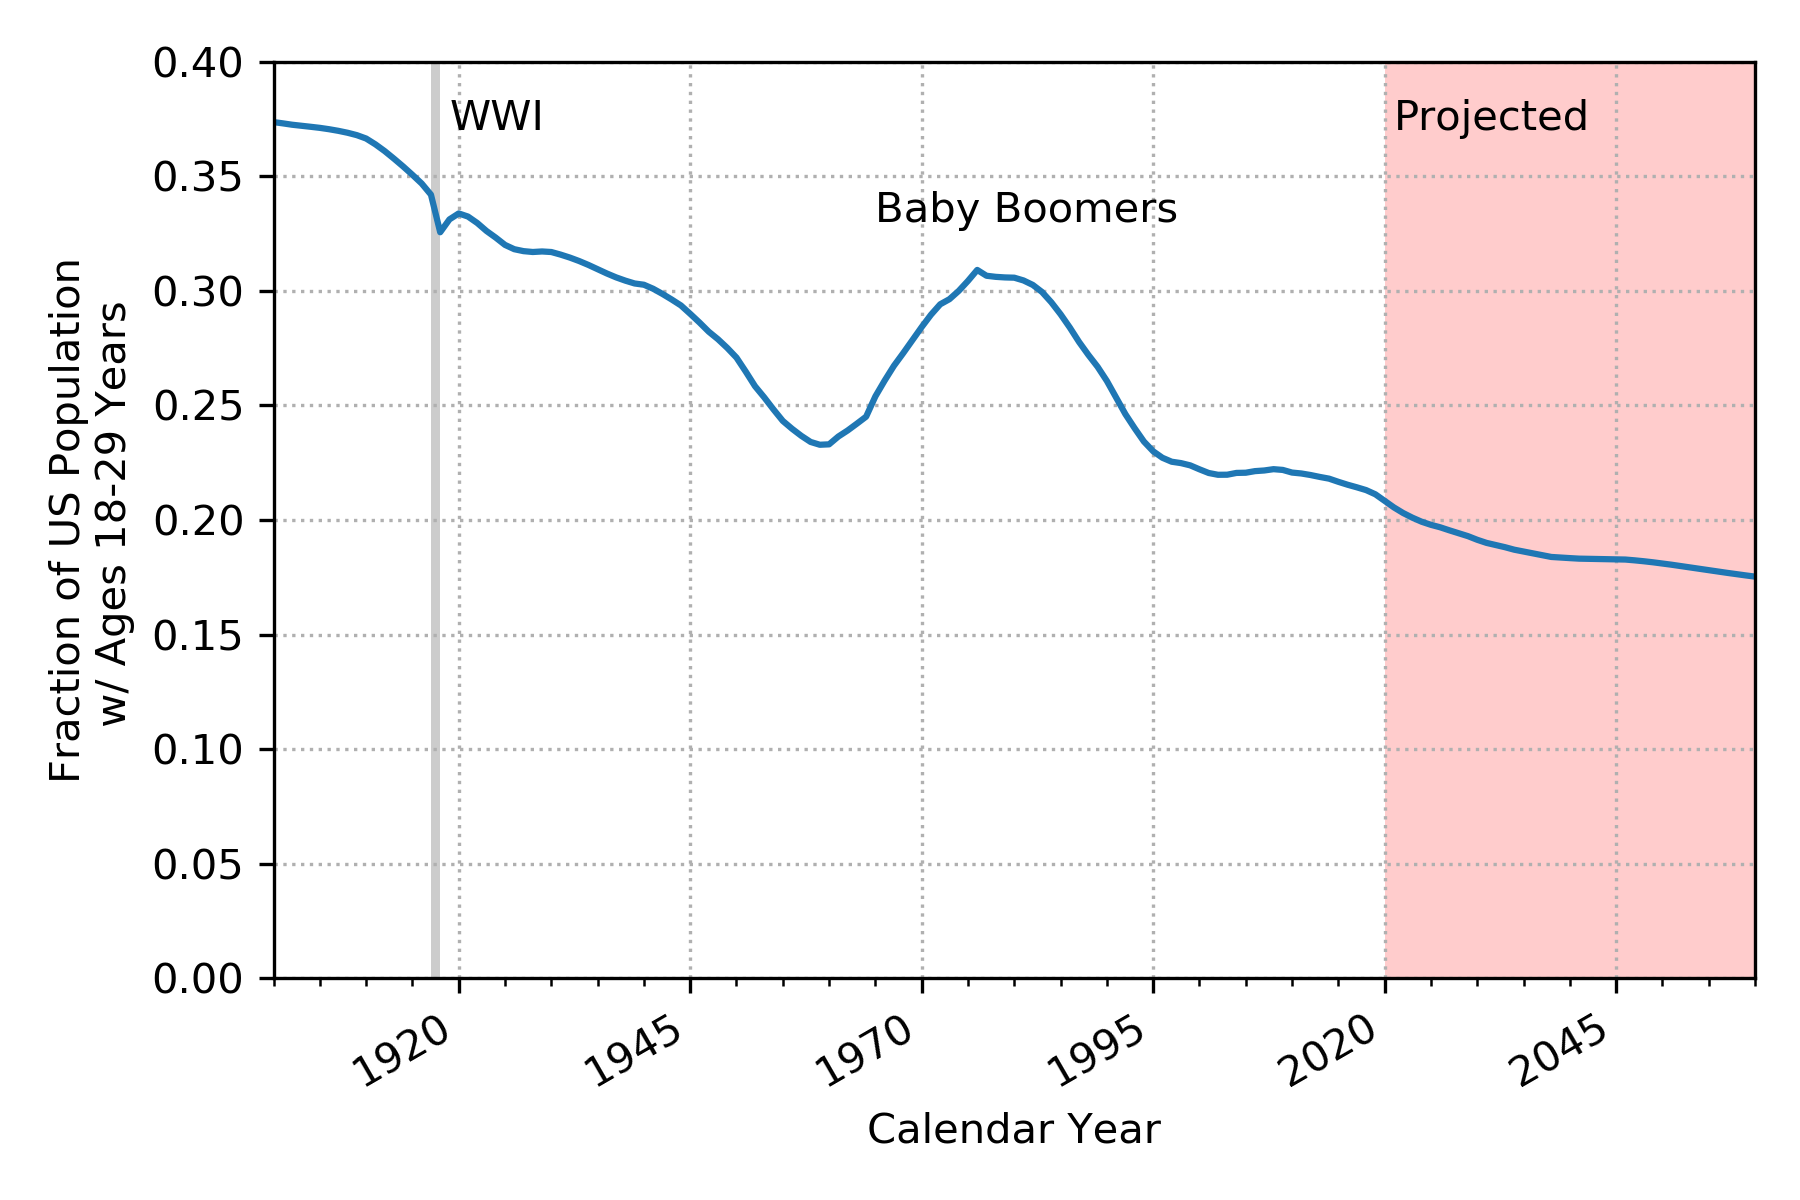
To first order, the most obvious feature of this plot is the general trend downwards from 37% in 1900 to 21% in 2020. The next most significant feature is the large bump from about 1965 to 1995, when the Baby Boomer generation aged into and then out of the 18-29 age range. Also noticeable in the figure is a relatively small dip around 1918, when more than 4 million (mostly young) service people were overseas fighting in WWI. This is the only wartime period associated with such a dip in the figure because the census population worksheets I found include the population of Armed Forces overseas after 1940.
Since 1972, when the major parties officially tied their convention delegates to the outcomes of state primaries, the fraction of the population comprised of 18-29 year-olds has decreased from 29% to 21%. This means that young people were outnumbered by all other voters ~2:1 in 1970 and are outnumbered by ~4:1 today.
Can the aging US population be the sole explanation for the drop in youth vote share between 2016 and 2020?
The short answer is, “No.” I found the population aged 18-29 grew by ~266,000 from March 1, 2016 to Mar 3, 2020 (by interpolating the yearly Census data) and the 30-and-over population has grown by ~8,774,000 in the same timespan. In terms of the youth fraction of the population, this results in an decrease of ~0.7% from 21.6% on Super Tuesday in 2016 (March 1) to 20.9% in on Super Tuesday in 2022 (March 3). Furthermore, if all voter demographic groups voted at the same rates as in 2016 (historical voting rate estimates from the Census Bureau were found here), the youth voter fraction would appear to decrease by only ~0.5% between 2016 and 2020 simply due to changes in the population age distribution. Since this is less than the 2.8% drop in the median youth vote share seen in 2020 exit polling compared to 2016, something in addition to age distribution change is needed to fully explain how the youth vote share could decrease in terms of percentage while increase in total number. As mentioned earlier, the simple explanation is that voters over 30 voted at a higher rate than they had four years ago.
How will projected demographic changes affect electorate compositions in future elections?
Looking at the youth population fraction plot at years after 2020, we see a steady decline to about 17% in 2060. That’s 4.6% less than it is today. This suggests that all future presidential campaign relying on voters aged 18-25 will have an even taller task than Bernie had in 2020.